

Odin Tick, Delta and Seconds Charts: 5 Types Explained
What closes a bar in Odin when a chart is built from seconds, trades, delta, price changes or boxes, and how each type behaves in a fast market and a quiet one.
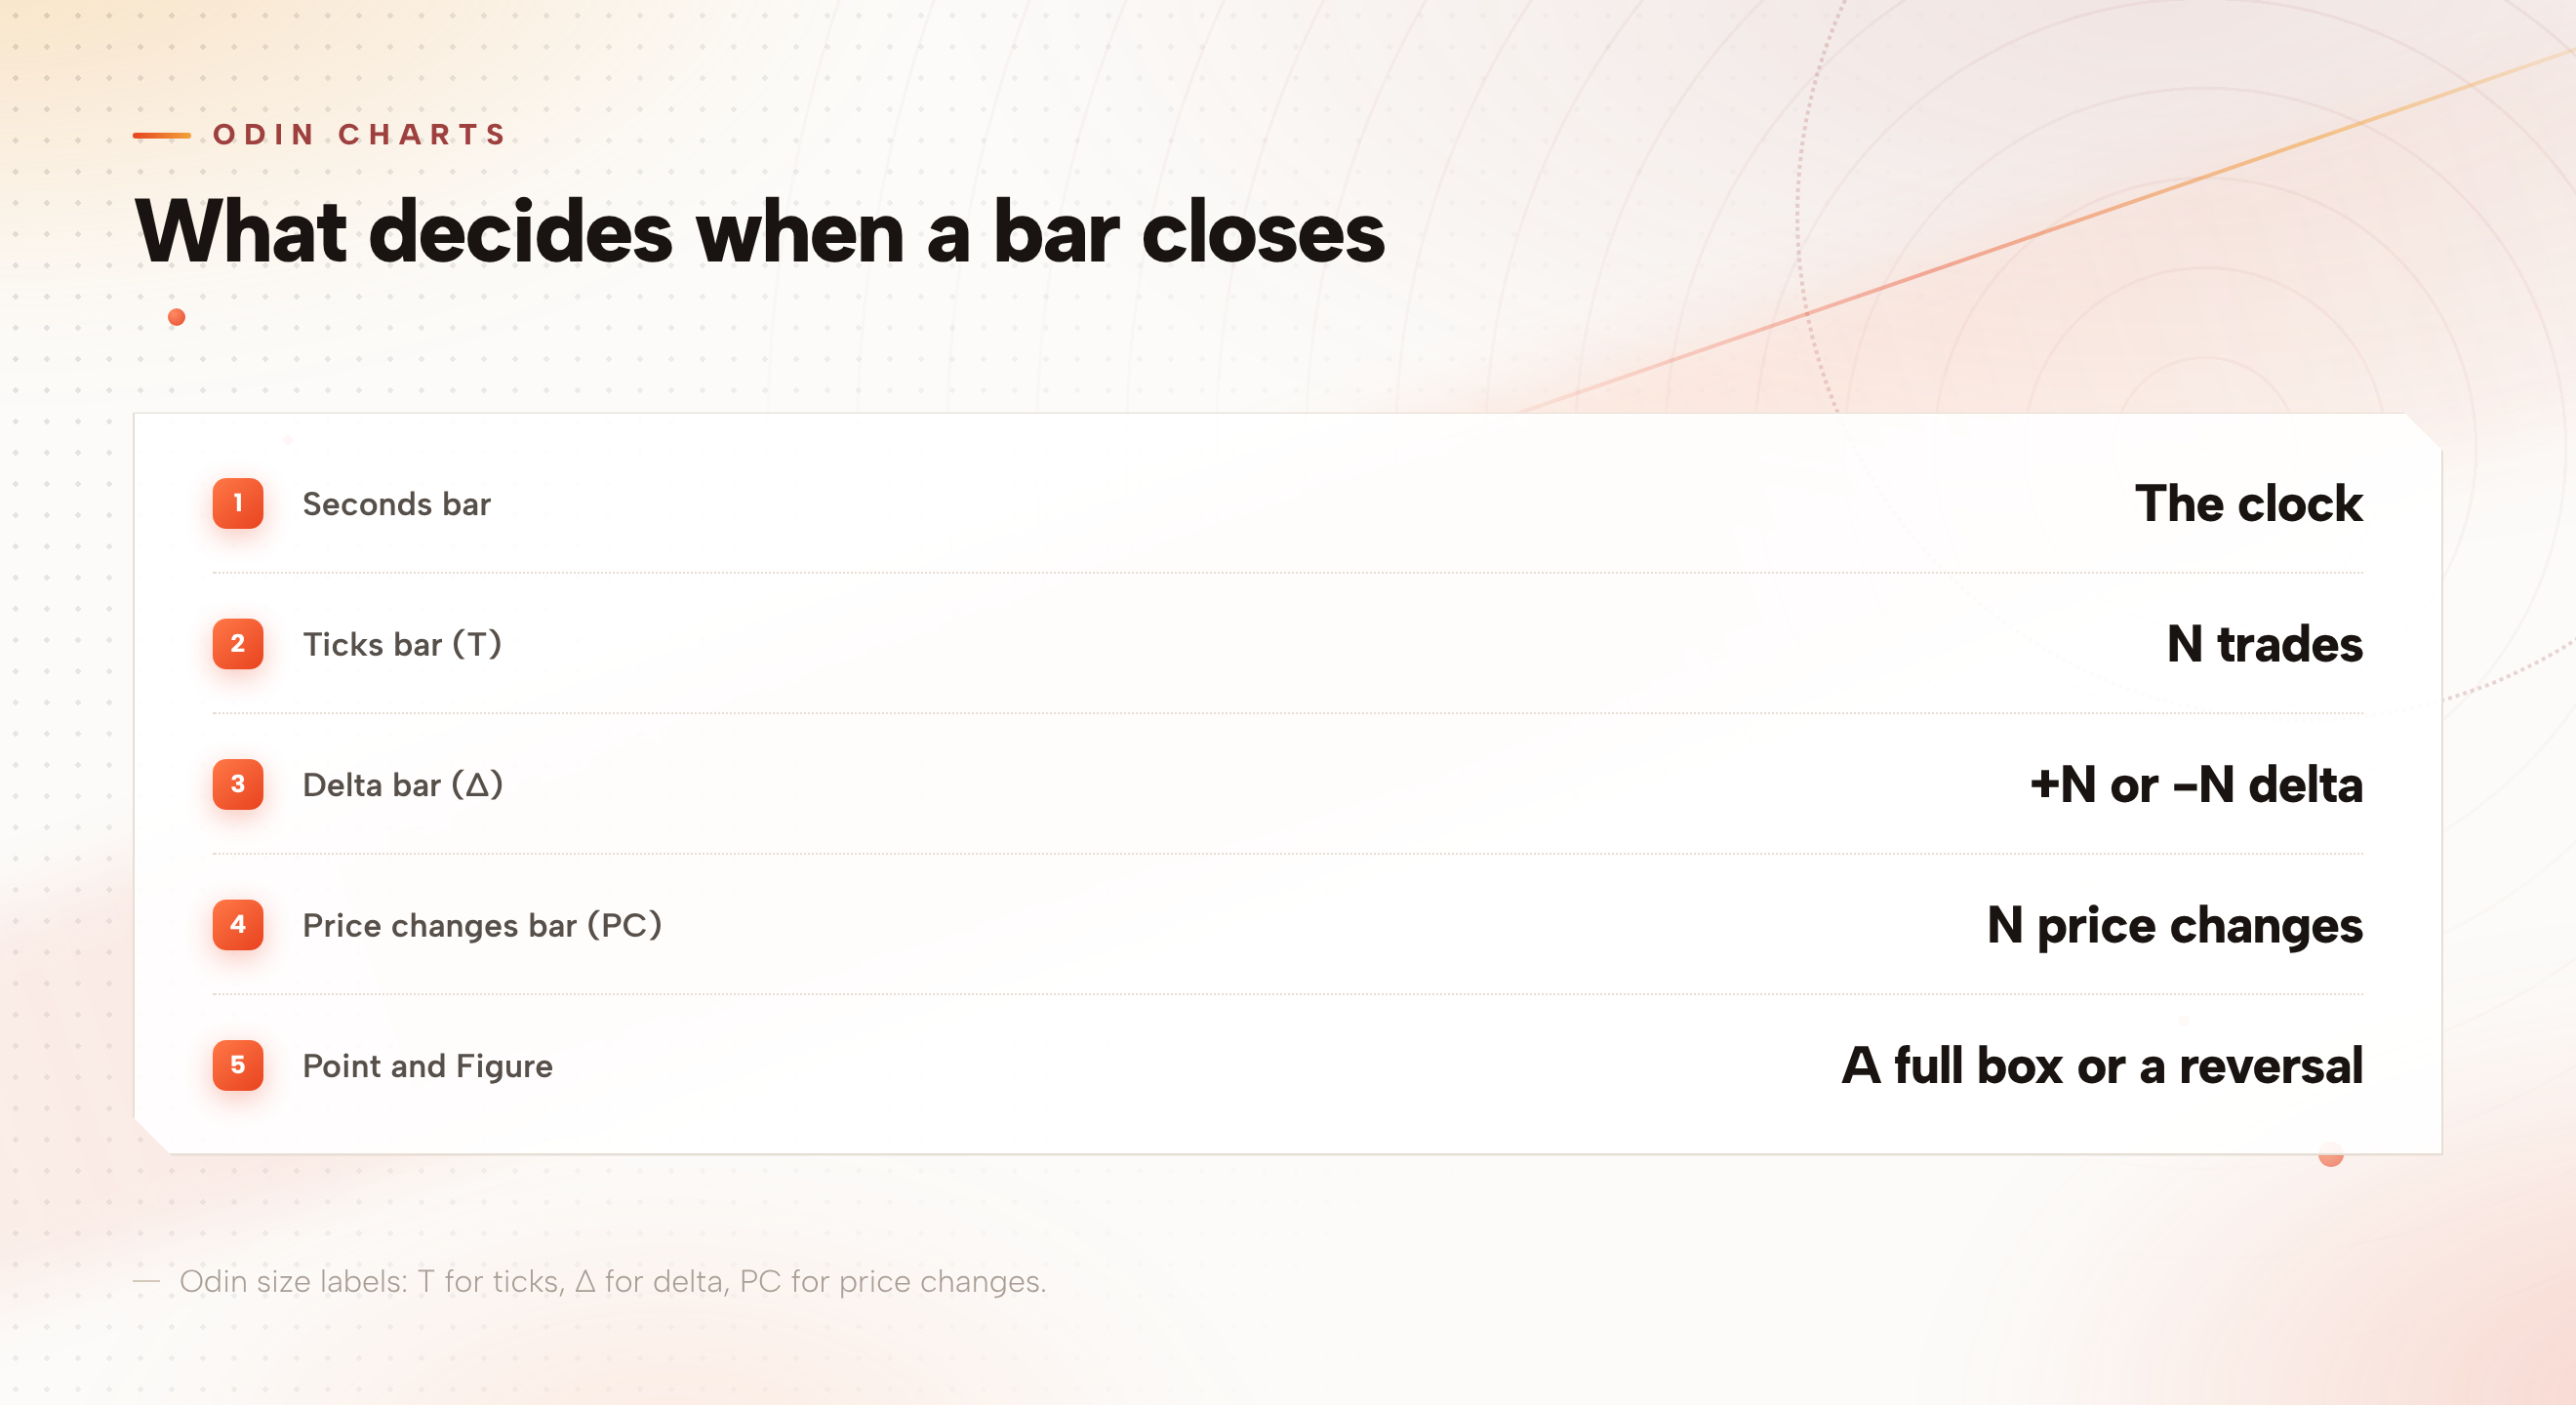
Besides minute candles, Odin charts can be built from seconds, trades, delta, price changes or Point and Figure boxes. A seconds bar closes on the clock, a tick bar after a set number of trades, and a delta bar when bought minus sold volume reaches +N or -N. Odin is the trading platform from Phoenix Trader Funding.
- Why the bar type changes what a chart shows
- Seconds charts: bars of 1 to 30 seconds
- Tick charts: a bar every N trades
- Delta bars: a bar closes at +N or -N
- Price changes bars and Point and Figure: price decides
- Which type answers which question
- Finding bar sizes in the timeframe selector
- What bar types change, and what they do not
- Frequently asked questions
Why the bar type changes what a chart shows
A bar is one candle or bar on a chart, a summary of the open, high, low and close for whatever built it. On a time chart the clock builds it. A one-minute bar closes at the end of the minute, whether a thousand trades printed in it or ten.
The other types let the market decide when a bar closes: after a number of trades, after buying and selling pull apart by a set amount, or after price has moved. Bars then stop arriving at an even pace, so the same session reads differently on the screen.
Seconds charts: bars of 1 to 30 seconds
A seconds chart is a time chart whose bars are shorter than a minute. Odin charts offer seconds timeframes of 1, 2, 5, 10, 15 and 30 seconds, plus a custom size, on every vendor, with native history on Rithmic and dxFeed.
On seconds and tick charts, a Session or Globex VWAP covers its whole day. VWAP, short for volume weighted average price, is the day's average price weighted by the volume traded at each price.
Tick charts: a bar every N trades
A tick chart builds each bar from a count of trades instead of from time. In Odin it is the Ticks timeframe, written with a T, and it gives a bar every N trades on every vendor. On TFeed Futures, one of the vendors Odin connects to, it opens with recorded history.
A tick here is one trade. It is not the tick size, which is the smallest price step a contract moves. A tick bar sized 500 closes every 500 trades, not every 500 price steps.
Because a tick bar closes on trade count, a fast market closes bars quickly and a quiet market closes them slowly. For background on the feed, read this Labs answer on which trading platforms work with a TFeed account.
Delta bars: a bar closes at +N or -N
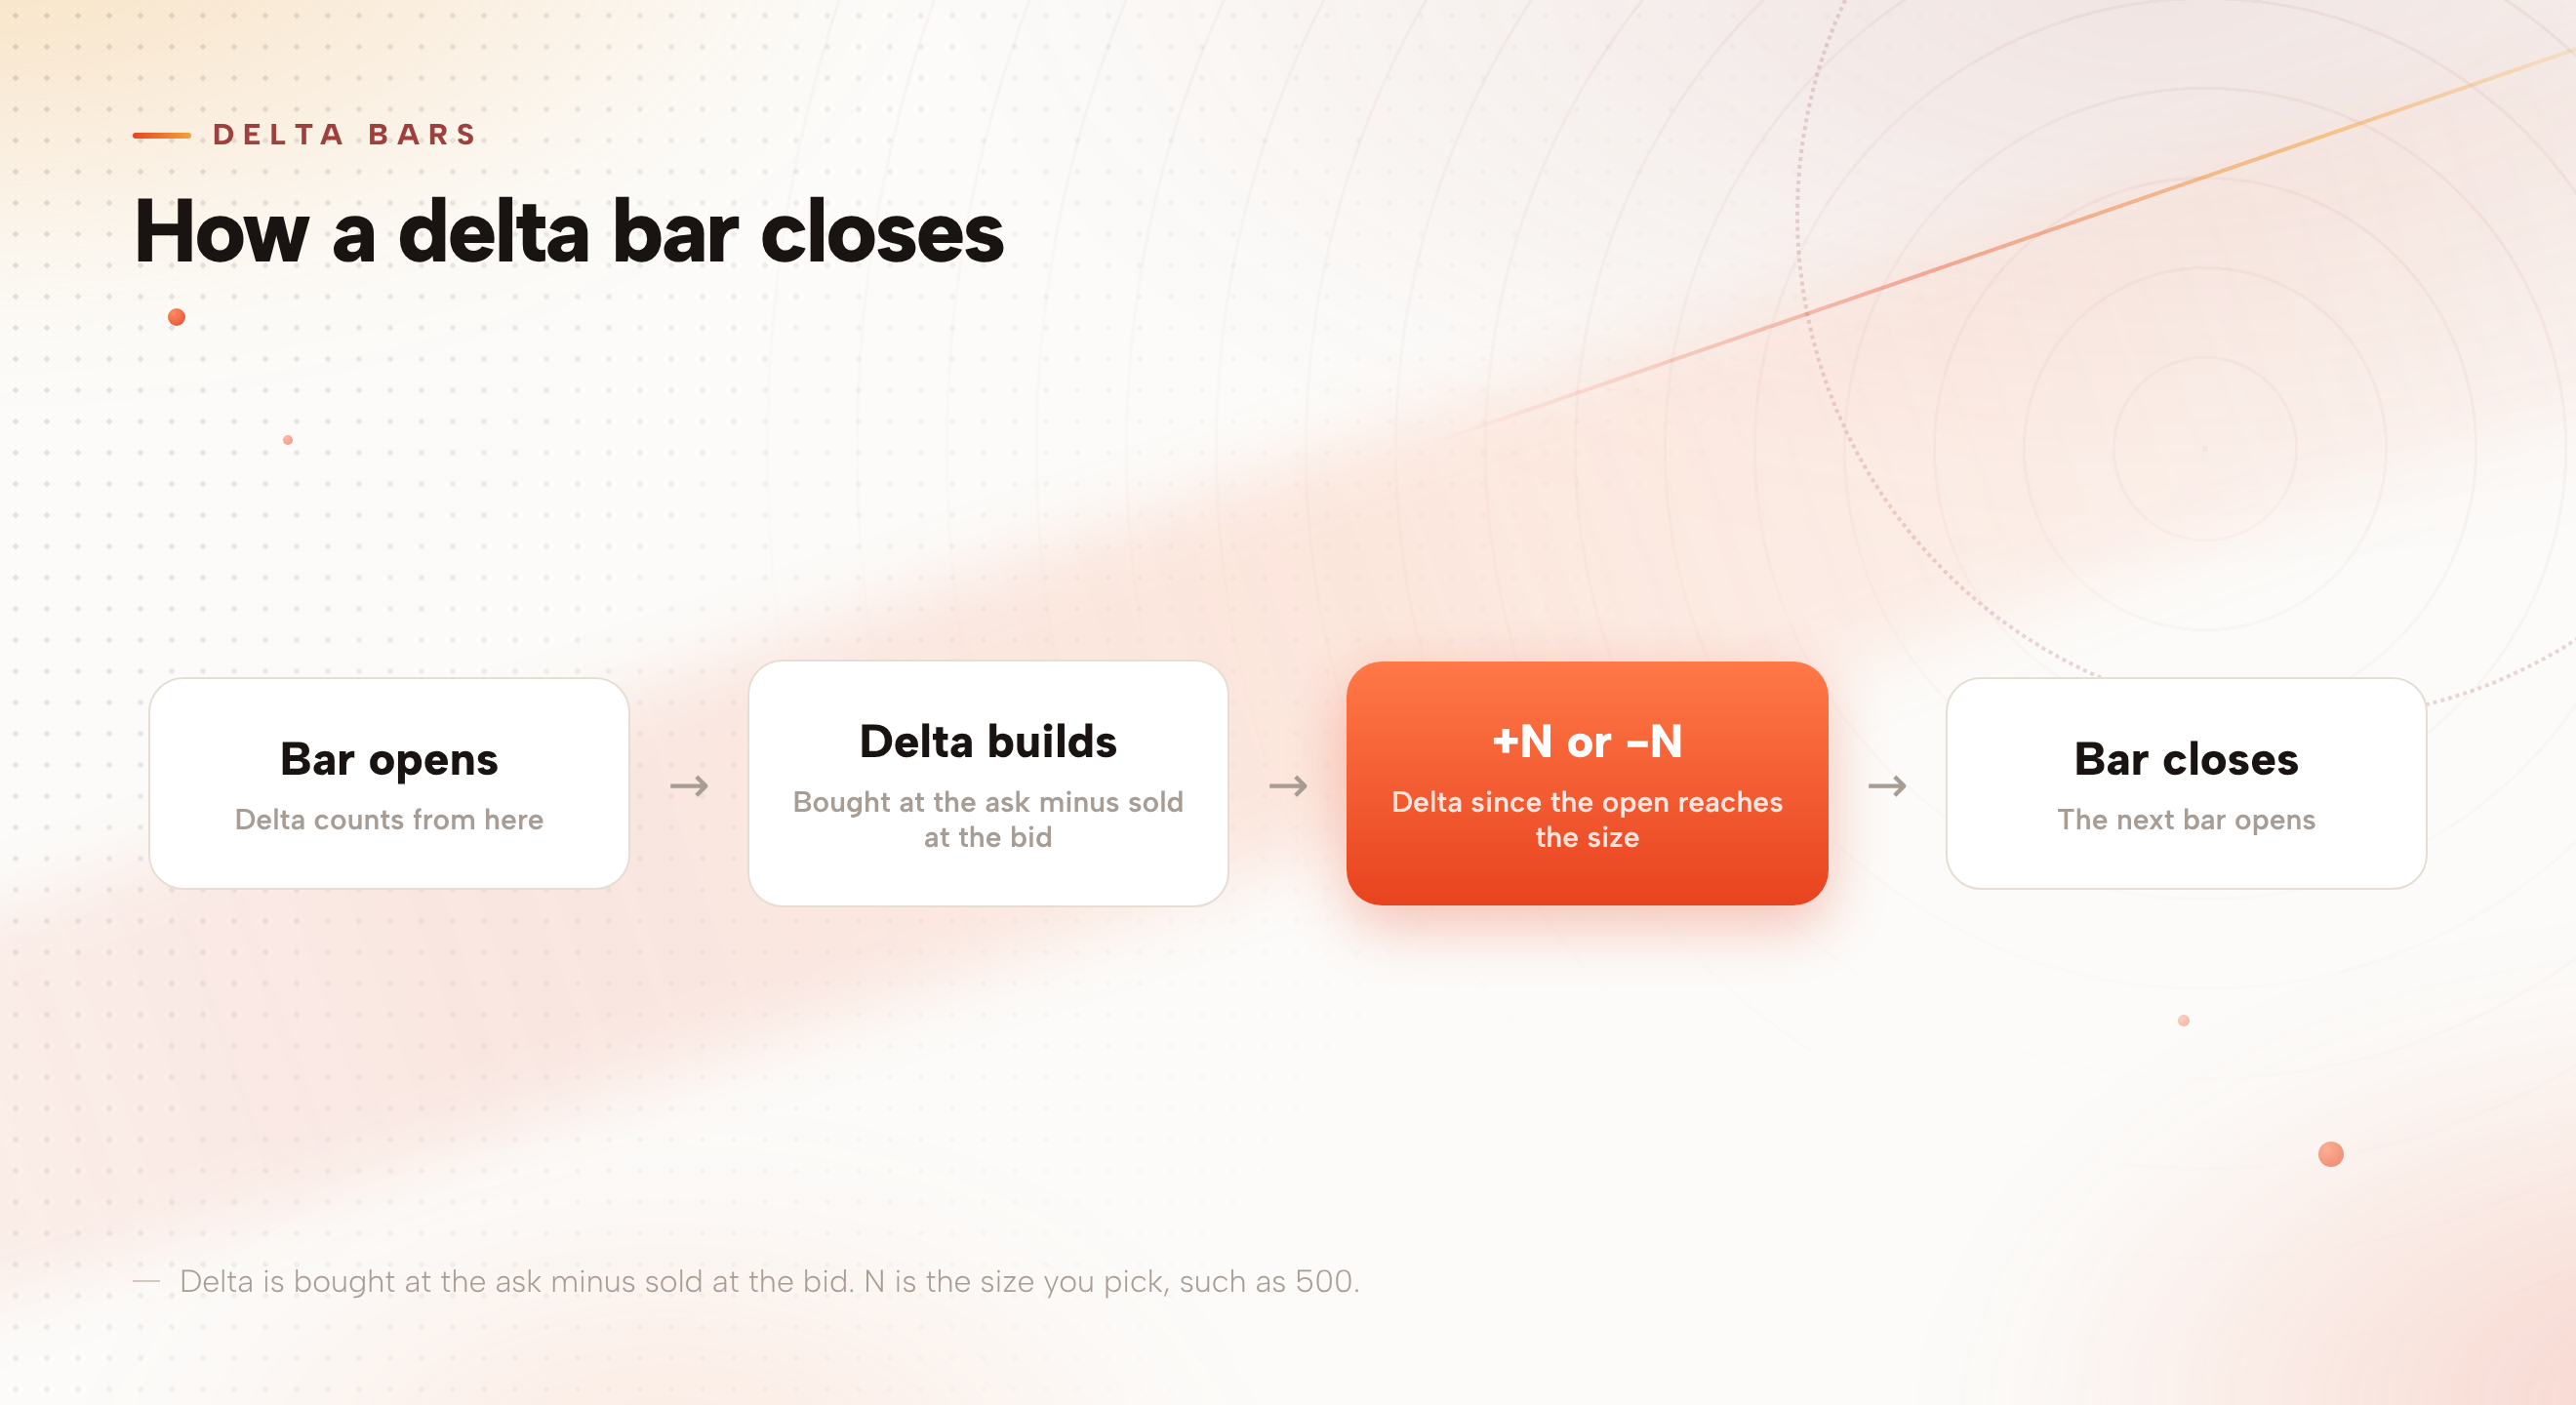
Delta is the volume bought at the ask minus the volume sold at the bid. A trade at the ask counts as bought and a trade at the bid counts as sold, so a positive delta means more volume traded at the ask than at the bid.
Odin charts offer Delta bars, written with the Δ sign after the size, so a size of 500 reads as 500 with a Δ. A price candle closes when the bought minus sold volume since it opened reaches +N or -N. The bar stays open while buying and selling roughly cancel out, and it closes once one side is ahead by N.
Delta bars and Delta Candles are separate features. Odin's Delta bars decide when a bar closes. Odin's Delta Candles color each candle by its own bar's delta, bought at the ask minus sold at the bid.
Price changes bars and Point and Figure: price decides
A price changes bar is still a candle, built from price changes instead of from time. Odin sizes it with a count followed by PC, such as a size of 1500.
A T bar and a PC bar are two different bars, not one bar under two labels. A ticks bar counts trades and a price changes bar counts price changes, so the T or PC after the size tells you which rule closes the bar.
Point and Figure is a chart style that draws no candles and ignores time. It draws columns of boxes, each box one fixed price step, and starts a new column only when price reverses. On Odin charts the columns are drawn as the chart series itself, following the TradingView model.
The boxes use the symbol's real tick, including on 6E, 6J, treasuries and Eurex. The real tick is the smallest price step the contract trades in.
Which type answers which question
None of these is better than the others. Each builds the chart on a different rule, so each behaves differently when the market is fast and when it is quiet.
| Type | Odin label | What builds it | In a fast or a quiet market |
|---|---|---|---|
| Seconds | 1 to 30 seconds, or custom | The clock | Bars arrive at a fixed pace, whatever the activity |
| Ticks | T after the size | A count of trades | Closes faster when more trades print and slower when fewer do |
| Delta | Δ after the size | Bought minus sold volume | Stays open while buying and selling cancel out, closes when one side leads by N |
| Price changes | PC after the size | A count of price changes | Follows price changes, not the clock and not the trade count |
| Point and Figure | Boxes in columns | Fixed price steps, drawn as boxes | Adds nothing until price moves a full box, and a reversal starts a new column |
Finding bar sizes in the timeframe selector
- Open the timeframe selectorClick the timeframe dropdown on the chart. It shows one row per timeframe class, and every size in it can be starred.
- Choose a sizeClick the size you want in its row, or a custom size if the presets do not fit: Odin charts support custom time timeframes.
- Star the sizes you reuseStar a size, custom ones included. Starred timeframes become the quick buttons, saved server-side.
- Check the watermarkLook at the chart watermark after you switch. It names the chart mode, so you can confirm which one you are on.
Odin's help menu sits under the ? in the top bar.
What bar types change, and what they do not
Bar type is a charting choice. It changes how a chart reads and nothing in it changes an account limit. Phoenix Trader Funding publishes drawdown, contract and payout rules per account type in the Help Center, so read the entry for the account you trade.
This guide describes charting features. It is education, not financial or trading advice, and trading futures carries a risk of loss.
Frequently asked questions
Does Odin have tick charts?
Yes. Odin charts offer a Ticks timeframe, written with a T, that gives a bar every N trades, on every vendor. On TFeed Futures it opens with recorded history.
What are delta bars on Odin?
Delta bars close on volume imbalance instead of time. A price candle closes when bought minus sold volume since it opened reaches +N or -N, and the size is written with a Δ after the number.
Can I use seconds charts in Odin?
Yes. Odin charts offer 1, 2, 5, 10, 15 and 30 second timeframes plus a custom size, on every vendor, with native history on Rithmic and dxFeed.
How are delta bars different from Delta Candles in Odin?
Delta bars decide when a bar closes. Delta Candles color each candle by its own bar's delta, bought at the ask minus sold at the bid.
Does Odin have Point and Figure charts?
Yes. Odin draws Point and Figure as columns of boxes instead of candles, starting a new column when price reverses, and the boxes use the symbol's real tick.
Pick the Phoenix Trader Funding account you want to trade, then try each bar type on an Odin chart before your first order.
Compare the evaluationsNew funded-account types are trialled at Phoenix Labs as real, tradable accounts before they join the permanent offer. The ones that work graduate.